
There’s a common expression that urges “Don’t miss the forest for the trees.” It points to the tendency we humans have to miss the bigger meaning because we’re lost in the minutiae.
This is something we deal with regularly at the Cyentia Institute as we delve deeply into the dark recesses of security datasets. It’s easy to get lost in interesting analytical side quests that don’t further the primary goal of extracting valuable, actionable insights for our audience.
But we also need to be wary of doing the opposite—missing the trees for the forest. I was reminded of that recently as we analyzed the data behind the Cobalt 2026 State of Pentesting Report.
The Forest: An Overall View of Remediation
One of the key findings from the prior (2025) report was that organizations only fix about half of their high-risk pentest findings. Furthermore, that ratio has been remarkably steady over time. It’s not surprising then that the message didn’t change much when we crunched the latest numbers. Here’s the (unpolished, unpublished) chart.
Overall proportion of high-risk findings resolved over time
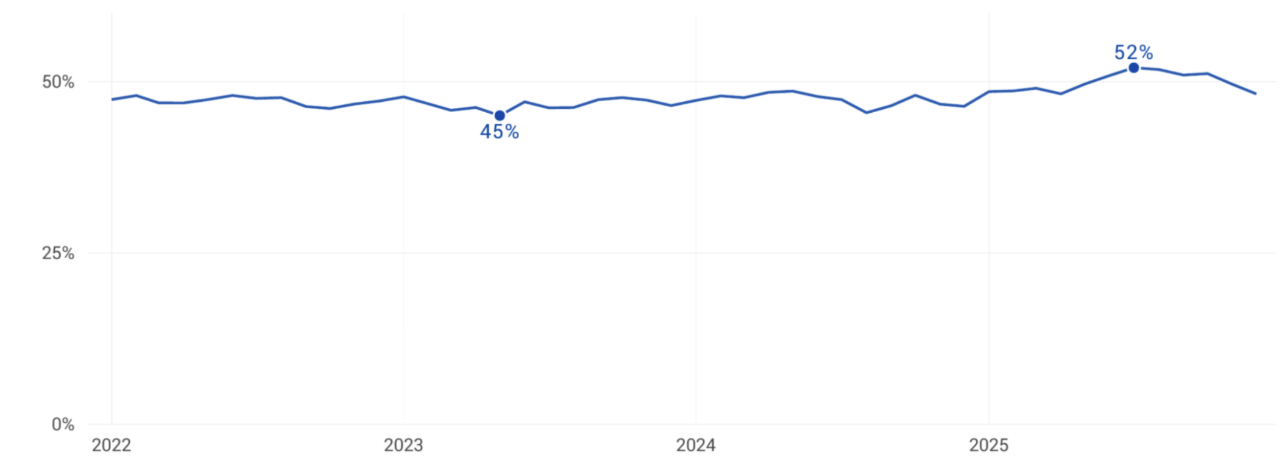
We noted in last year’s report that this apparent remediation stalemate begged the question of “Why?” Why do organizations that go through the effort of conducting a penetration test only remediate half of their riskiest exposures? It seems counterintuitive, but the numbers checked out, and we reported the finding.
Since this was the second time working on this report, we had a bit more time to chase intriguing questions. This one was at the top of our list.
The Trees: An Organizational View of Remediation
The first thing we wanted to do was get an organizational-level view of resolution rates. After all, one of the dangers of averages is that they tend toward…well, the average. Do most individual organizations resolve about half of their findings, or do some knock them all out while others fix nothing? Here’s what emerged (again, not the final chart used in the report):
Proportion of high-risk findings resolved per organization
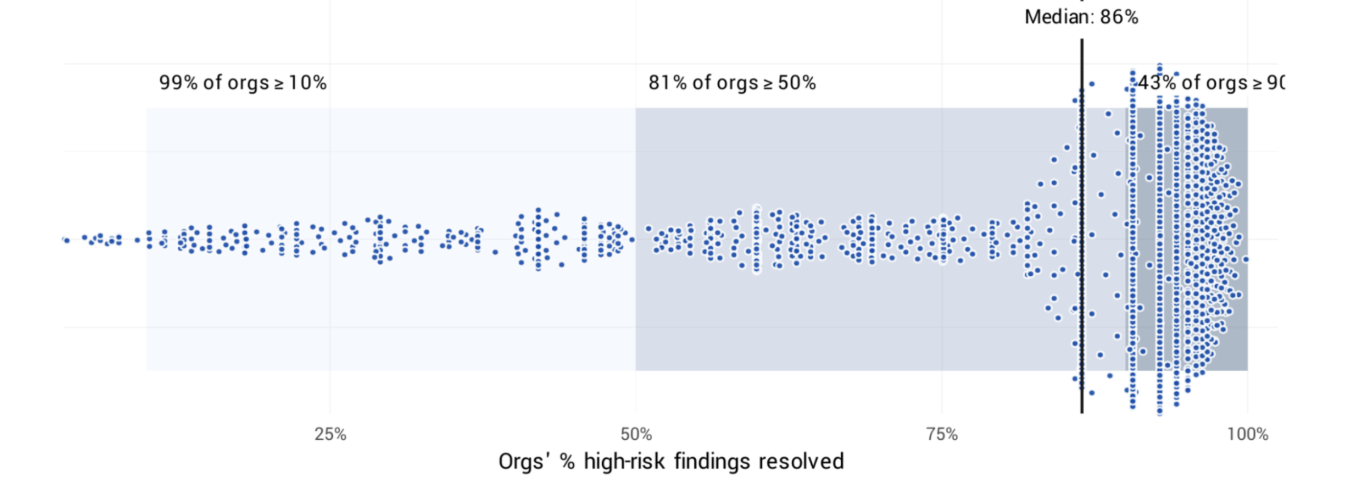
This is an example of where examining the trees (organizations) offered a more realistic and useful perspective than the forest (overall %). It’s clear from this view that the majority of organizations resolve most of their high-risk findings. And yet we also see a wide disparity, with some firms exhibiting very low remediation rates.
As is often the case in research, answering one question brings up several more. Foremost in my mind was how both of these stats could be true. How can the overall resolution rate be ~50% and the per-org median be 86%? It helps to be precise about what each figure measures: the ~50% pools every finding together (finding-weighted), while the 86% is the median across organizations—each one counting once, no matter how many findings it carries.
Perhaps some of the organizations at the lower end of the resolution spectrum have a large number of findings, which drag the aggregate rate down? Let’s check the allocation of all findings across organizations. Hmmm…nope. This draft chart shows that we don’t have just a few orgs responsible for the lion's share of findings.
Proportion of all unresolved findings tied to each organization
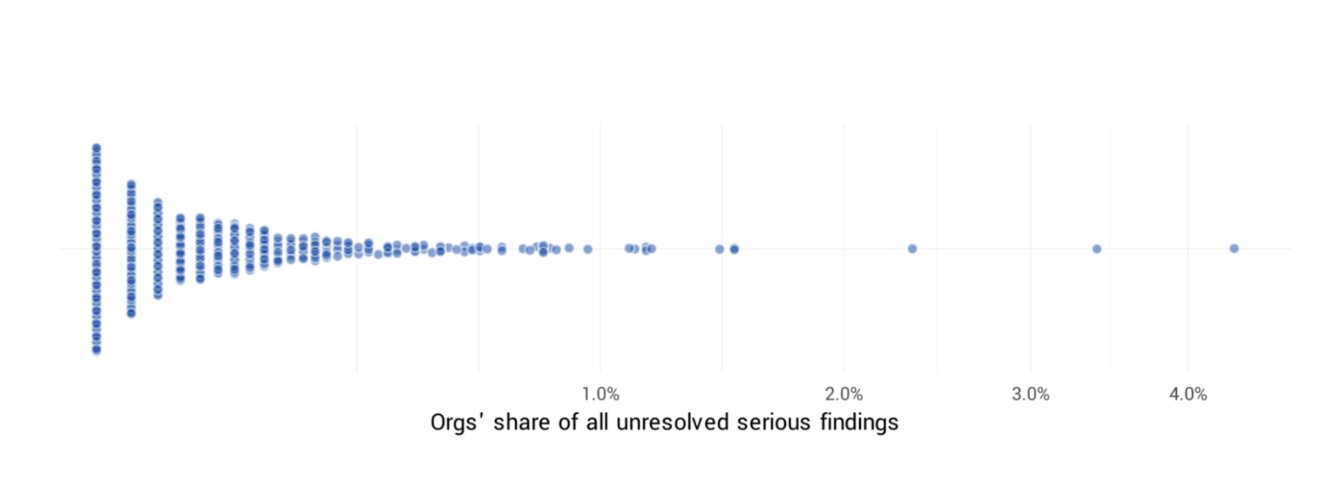
Pulling more on this thread, we discovered that the volume of pentest findings isn’t the singular deciding factor between organizations that resolve most of their risky findings vs. those that don’t. Here’s the exploratory chart that backs up that statement.
Number of pentest findings for organizations that resolve all/some/none
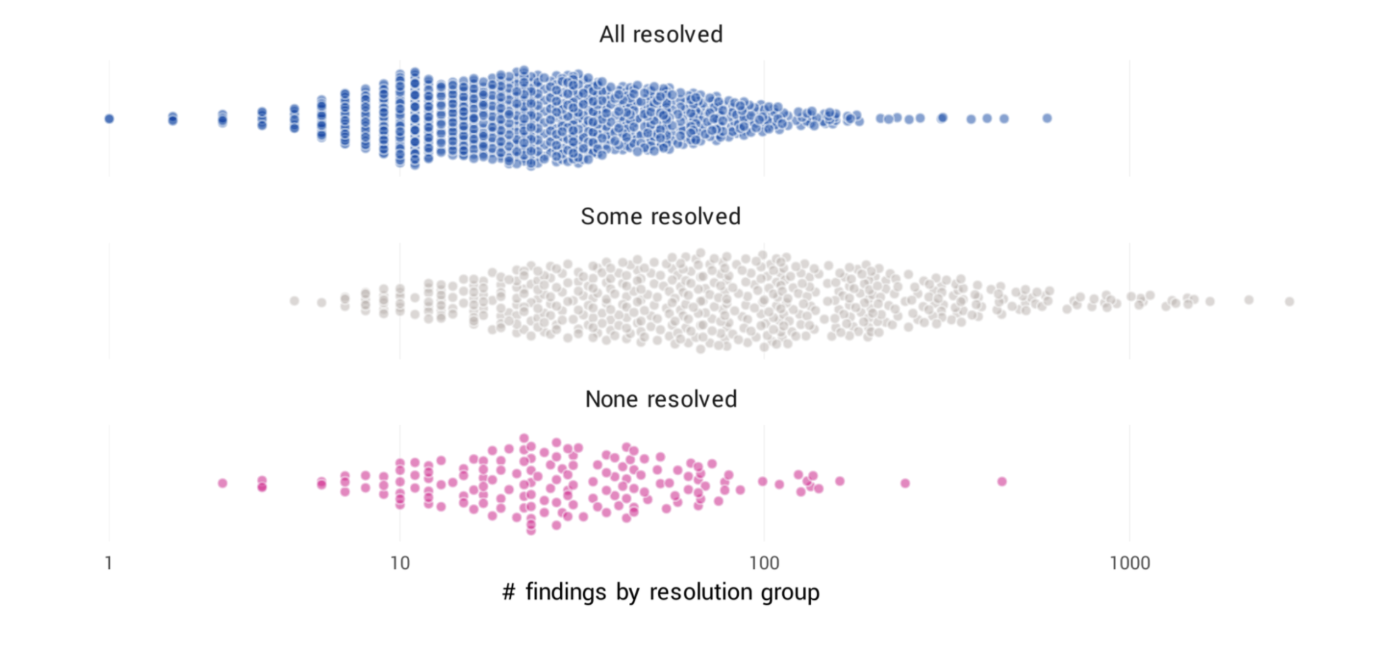
The distribution for organizations that only resolve “some” of their findings has a notably fatter, longer tail, meaning more firms have higher numbers of findings. But be careful there. It’s also obvious that the groups overlap substantially. In other words, having a hundred findings doesn’t doom your remediation efforts to fail by default. Nor does having just 10 guarantee success.
Wrapping up: Resolving the Resolution Discrepancy
So how are both views—forest and trees—correct? Well, they answer different questions. The 86% is organization-weighted: each org counts once, whatever its vulnerability count. The ~50% is finding-weighted: it pools every high-risk finding and asks what share got fixed.
With most organizations clearing well over half their findings, an org-level median lands far higher. The only way the pooled rate reaches ~50% is that findings are weighted by volume, and the volume scale tips toward the organizations resolving the smallest share. The last chart shows exactly that: the majority of firms carrying hundreds or thousands of pentest findings cluster in the “some resolved” group.
That’s the trees-and-forest trap captured in a single dataset. Stand back, and the forest looks stalled at half-remediated. Walk in among the trees, and you find that most organizations actually clear the large majority of their high-risk findings. And the aggregate is held down by a smaller stand of high-volume environments working through deep backlogs of vulnerabilities.
Volume isn’t the only thing shaping that picture; what’s being remediated matters too. For example, we showed in the 2026 report that resolution rates for AI applications are far below those of web applications.
The lesson here isn’t “Half of organizations are ignoring half their risk.” It’s that there’s a huge disparity in the efficacy of remediation among organizations. And we need to get to the bottom of what drives that. Sure, volume is part of it. The scope of the pentest and types of assets contribute too. But evidence shows many teams getting the job done despite having highly vulnerable, highly diverse environments.
Miss that—and the call to measure your own organization’s performance—and you’ve missed seeing the health of the trees for the shape of the forest.