
Mean (or median) time to response (MTTR) is the de facto standard for measuring how long it takes to perform a security action. Whether it’s responding to an attack, remediating vulnerabilities, or resolving pentest findings, MTTR is one of the most commonly reported statistics across industry reports.
The latest State of Pentesting Report pegs the overall MTTR at 67 days across all pentest findings, with the highest risk findings typically resolved a couple of weeks faster (50 days). Whether that’s fast or slow likely depends on your perspective and is not the point of this post. The point is that MTTR only tells half the story of resolving pentest findings.
The fact is that MTTR is inherently overly optimistic. Yes, it measures how long it takes to resolve findings, but it overlooks findings that are never resolved. That’s an important caveat when you realize that more than half (52%) of all pentest findings fall into that never-fixed bucket. What’s more indicative of the organization’s true progress toward remediation—fixing half of the vulnerabilities in 67 days, or leaving half of them unresolved?
The answer, of course, is both. Ideally, we need a way to measure both speed and progress toward the complete resolution of all findings. Despite the name, the survival half-life tells the whole story of vulnerability remediation.
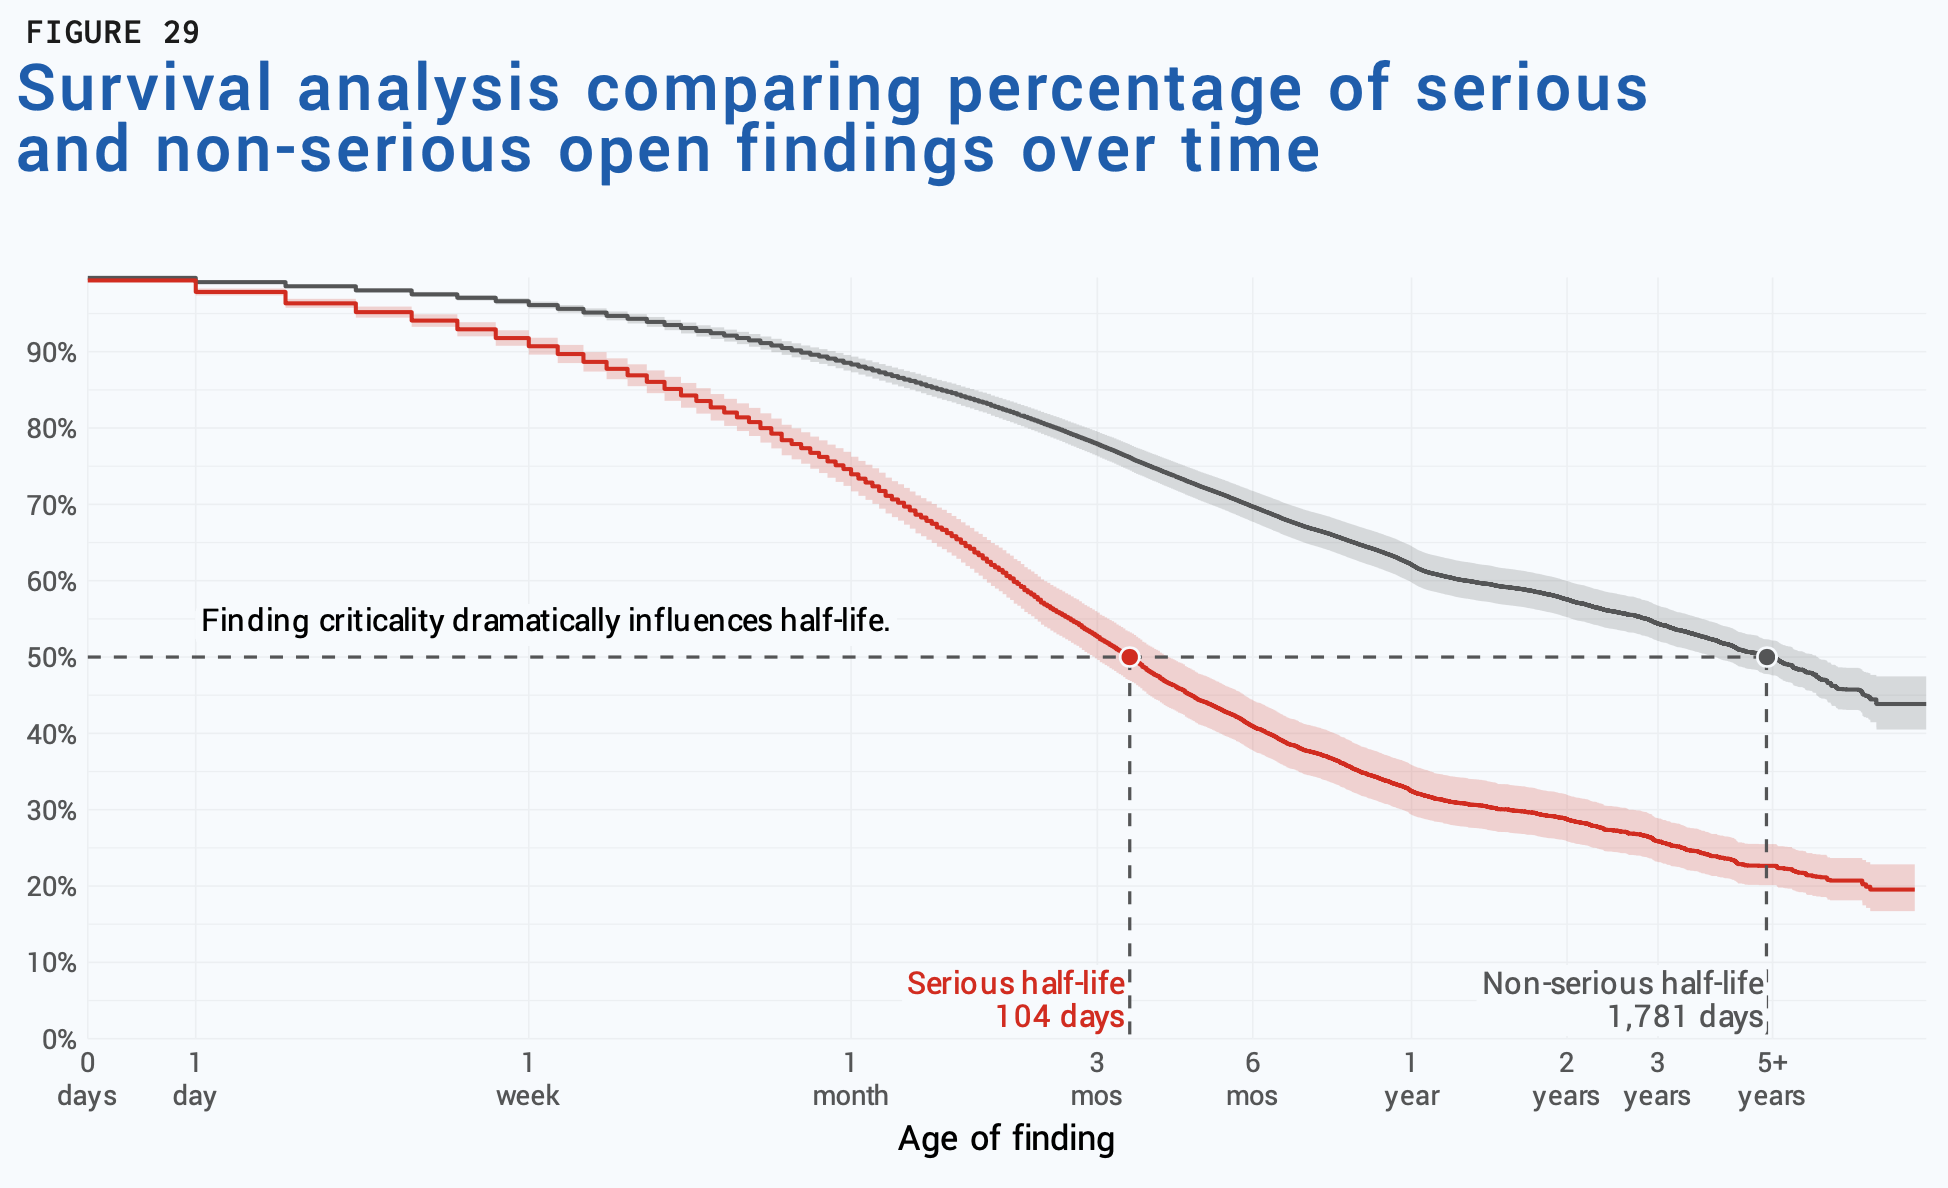
Survival analysis of pentest findings (Source: Cobalt and Cyentia Institute)
Survival analysis is a statistical technique that measures how long it takes for an event to occur (e.g., decay of radioactive nuclides or failure of equipment). Specific to our use case, that event is the resolution (death) of pentest findings. Survival analysis offers a more realistic view of remediation because, unlike MTTR, it accounts for both fixed and unfixed issues throughout their life cycle.
The 2025 State of Pentesting Report pegs the overall half-life of pentest findings at 3.2 years. That’s obviously a very different story than the one told by a 67-day MTTR. If we focus on the most serious (high or critical) findings, half-life improves to 104 days, indicating that criticality plays a huge role in prioritizing what gets fixed first. It also conveys the sobering truth that many vulnerabilities—that can still be exploited—persist for a very long time.
Half-Life Beyond Pentests
So, is 104 days (or 3.2 years) fast or slow? Again, this is a matter of perspective that I’m not going to address directly here. I would like to, however, address it indirectly in comparison to measures of half-life in other domains of infosec beyond pentesting.
At the Cyentia Institute, we measure remediation half-life whenever the dataset in question is suitable for survival analysis. We’ve had that opportunity multiple times over the years, and I’ll share a few examples in the charts that follow.
Let’s start with application security testing via static and dynamic code analysis. Cyentia has worked with Veracode on the annual State of Software Security (SOSS) for several years. The chart below comes from the latest SOSS, which measured a half-life of 252 days across all types of testing and applications. So, AppSec flaws survive more than twice as long as serious pentest findings.
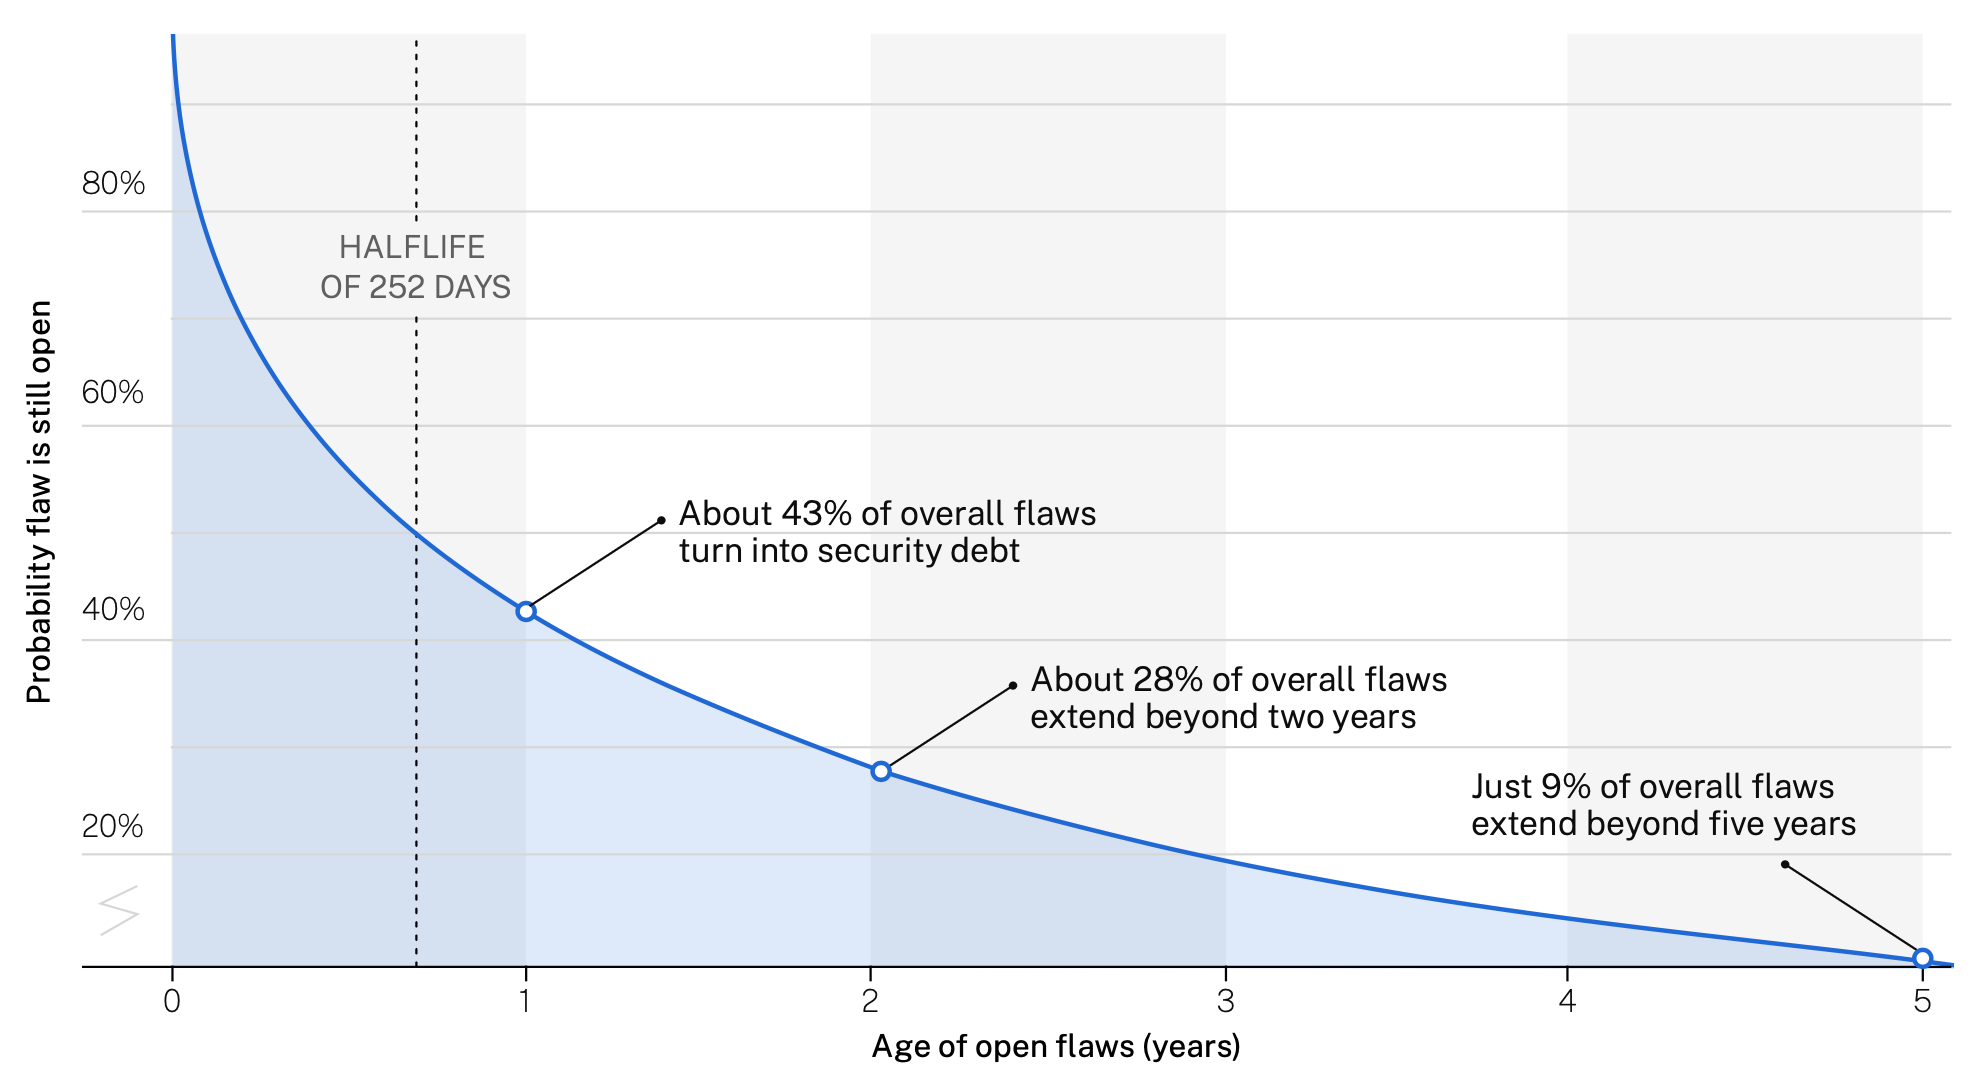
Survival analysis of application security flaws (Source: Veracode & Cyentia Institute)
Let’s take a peek into the world of traditional vulnerability scanning and patching of CVEs. This comes from Cyentia’s long-running Prioritization to Prediction series with Kenna Security. The chart below compares the half-life of vulnerabilities in different categories of infrastructure. Here we see that vulnerabilities affecting Microsoft platforms are fixed in about a third of the time it takes to resolve pentest findings (automated patching FTW), while network appliances and devices take three times longer.
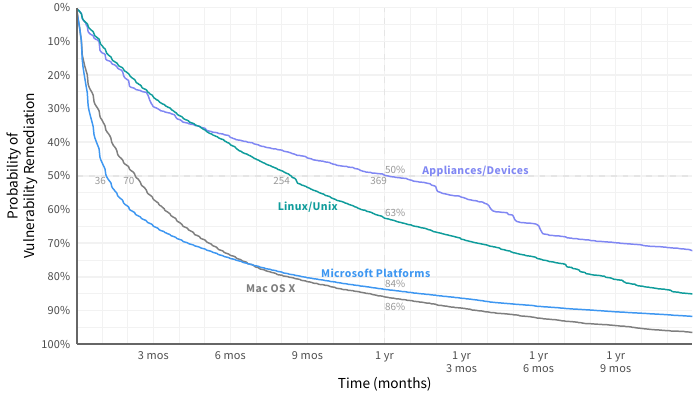
Survival analysis of infrastructure vulnerabilities (Source: Kenna Security & Cyentia Institute)
Let’s do one more. This time, we’ll look at the survival time of vulnerabilities in internet-facing assets assessed through third-party risk monitoring. This comes from Cyentia’s collaboration with SecurityScorecard in The Fast and the Frivolous report. The vulnerability half-life was clocked at just short of one year (361 days), well over three times the rate observed in the latest State of Pentesting Report.
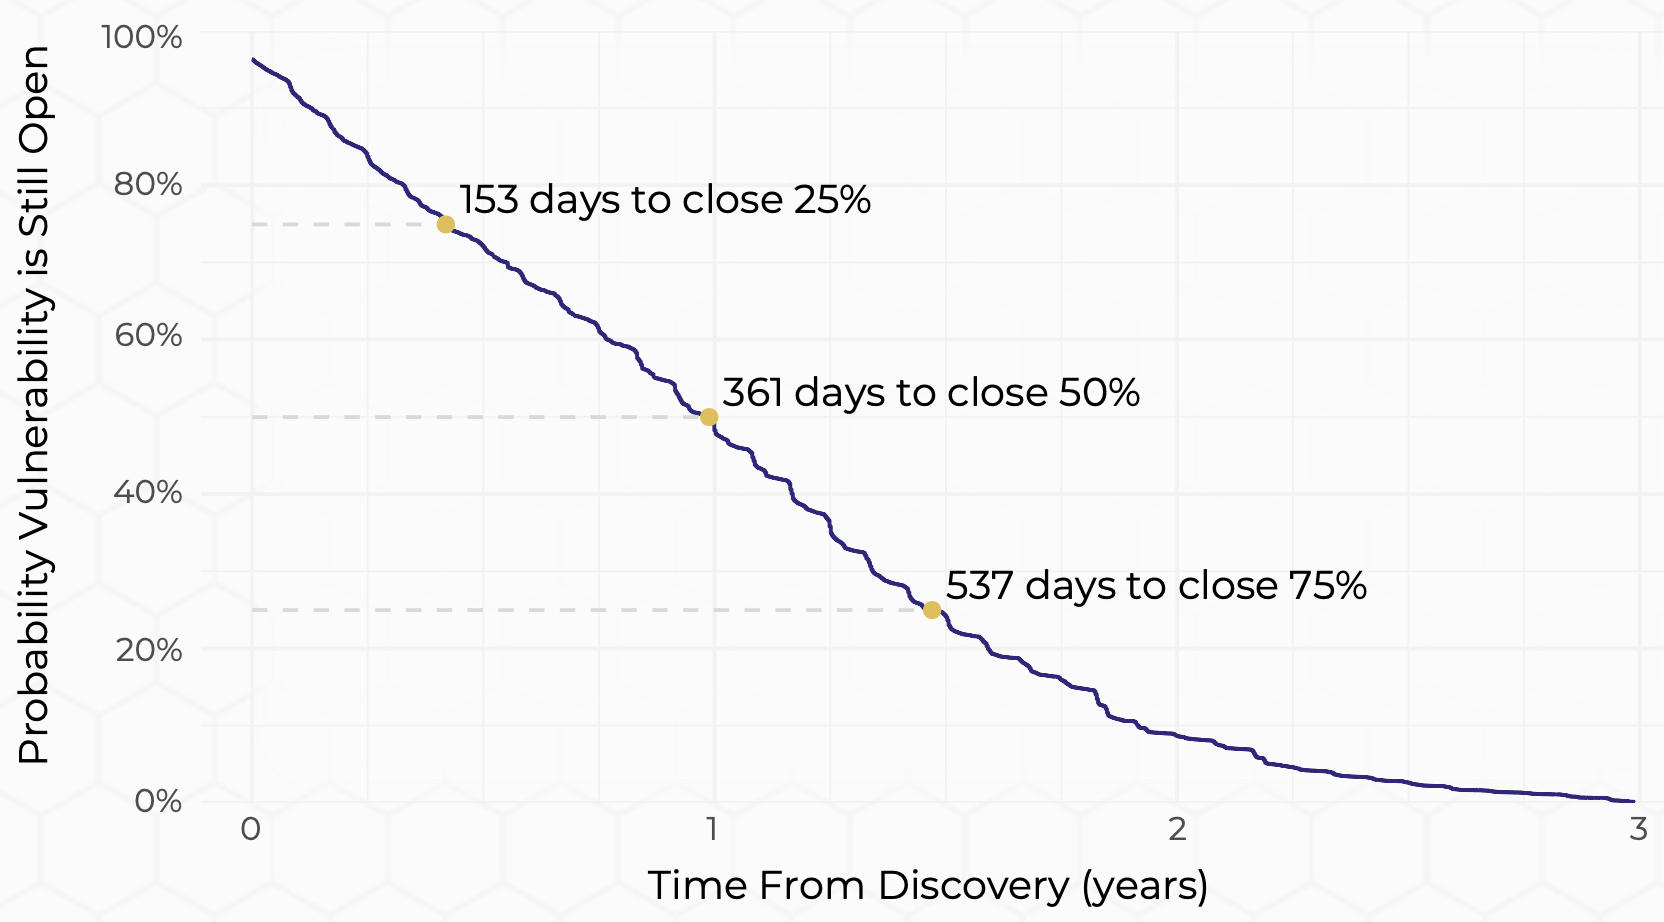
Survival analysis of third-party security vulnerabilities (Source: SecurityScorecard & Cyentia Institute)
Admittedly, none of these other datasets offer an exact apples-to-apples comparison to pentest findings. They all have their own unique types of vulnerabilities, discovery mechanisms, remediation intricacies, et cetera. However, these results are at least comparable. And I hope this extra information helps provide some useful context for those struggling to interpret the seemingly lengthy half-life of pentest findings in the State of Pentesting Report.
Obviously, the desired response from this isn’t “Great; so serious pentest findings are resolved faster than those found via SAST/DAST, vulnerability scanning, and third-party risk monitoring—we’re good to go!” There’s definitely room and need for improvement. I’m hoping we continue to see improvement in the Cobalt data about resolved findings in future State of Pentesting Reports.
Get the Full Story
Want to delve deeper into these critical insights and gain a comprehensive understanding of vulnerability remediation? Download the complete Cobalt 2025 State of Pentesting Report today to gain a comprehensive understanding of MTTR, survival half-life, and how your organization's security posture compares to industry benchmarks.