Make sure to check out our Integrations page for more info!
Last week we announced the launch of the Cobalt API—a feature meant to enable our users to get even more value from our platform. One area where the Cobalt API particularly helps is reporting.
We’ve learned from our customers that reports should be customizable, but also accessible to people who don’t have direct access to the Cobalt platform. In this article, I’m going to show you how to use the Cobalt API and Google Sheets to create a fully customizable report which you can share with anyone without having to give them access to your organization’s account.
What Is the Cobalt API?
The Cobalt API helps you transfer pentest data from our platform into other tools and services. It allows you to integrate data in your own application, making it easy for developers to work with the info. The Cobalt API is an excellent way to build in-house analytics based on your pentests results. All your data is accessible so you can automate more of your workflows and build custom integrations.
Getting Started With the Cobalt API
First, let’s break down the two types of tokens you’ll need to pull your pentest data: your API Token, and your Org Token.
Generating Your API Token
The API Token is available in the Cobalt platform and you can access it by following these steps:
- Go to the “Profile” section in the platform’s navigation and select “API Token.”
- Press “Generate token.”
- Save your token in a safe place. After exiting the page, you won’t be able to see your token until you create a new one.
- Don’t share your token with anyone! Anyone holding it will be able to access your pentest data via your account.
Why have two API tokens?
Aside from strengthening the API’s security, we’ve implemented a two-token system for operational reasons. When you use the Cobalt platform, you’re logged in as yourself and your account is registered underneath an organization. Authorization needs to replicate that behaviour for the API to successfully identify and pull the right information.
Generating Your Org Token
Navigate to our official documentation page, where you can find premade code samples you can use with your API Token. To keep the process simple, we'll use Swagger UI for the initial query. Navigate to "Explore our API in Swagger" at the bottom of the left sidebar. Using Swagger’s UI, select our production server “api.cobalt.io” and press "Authorize."
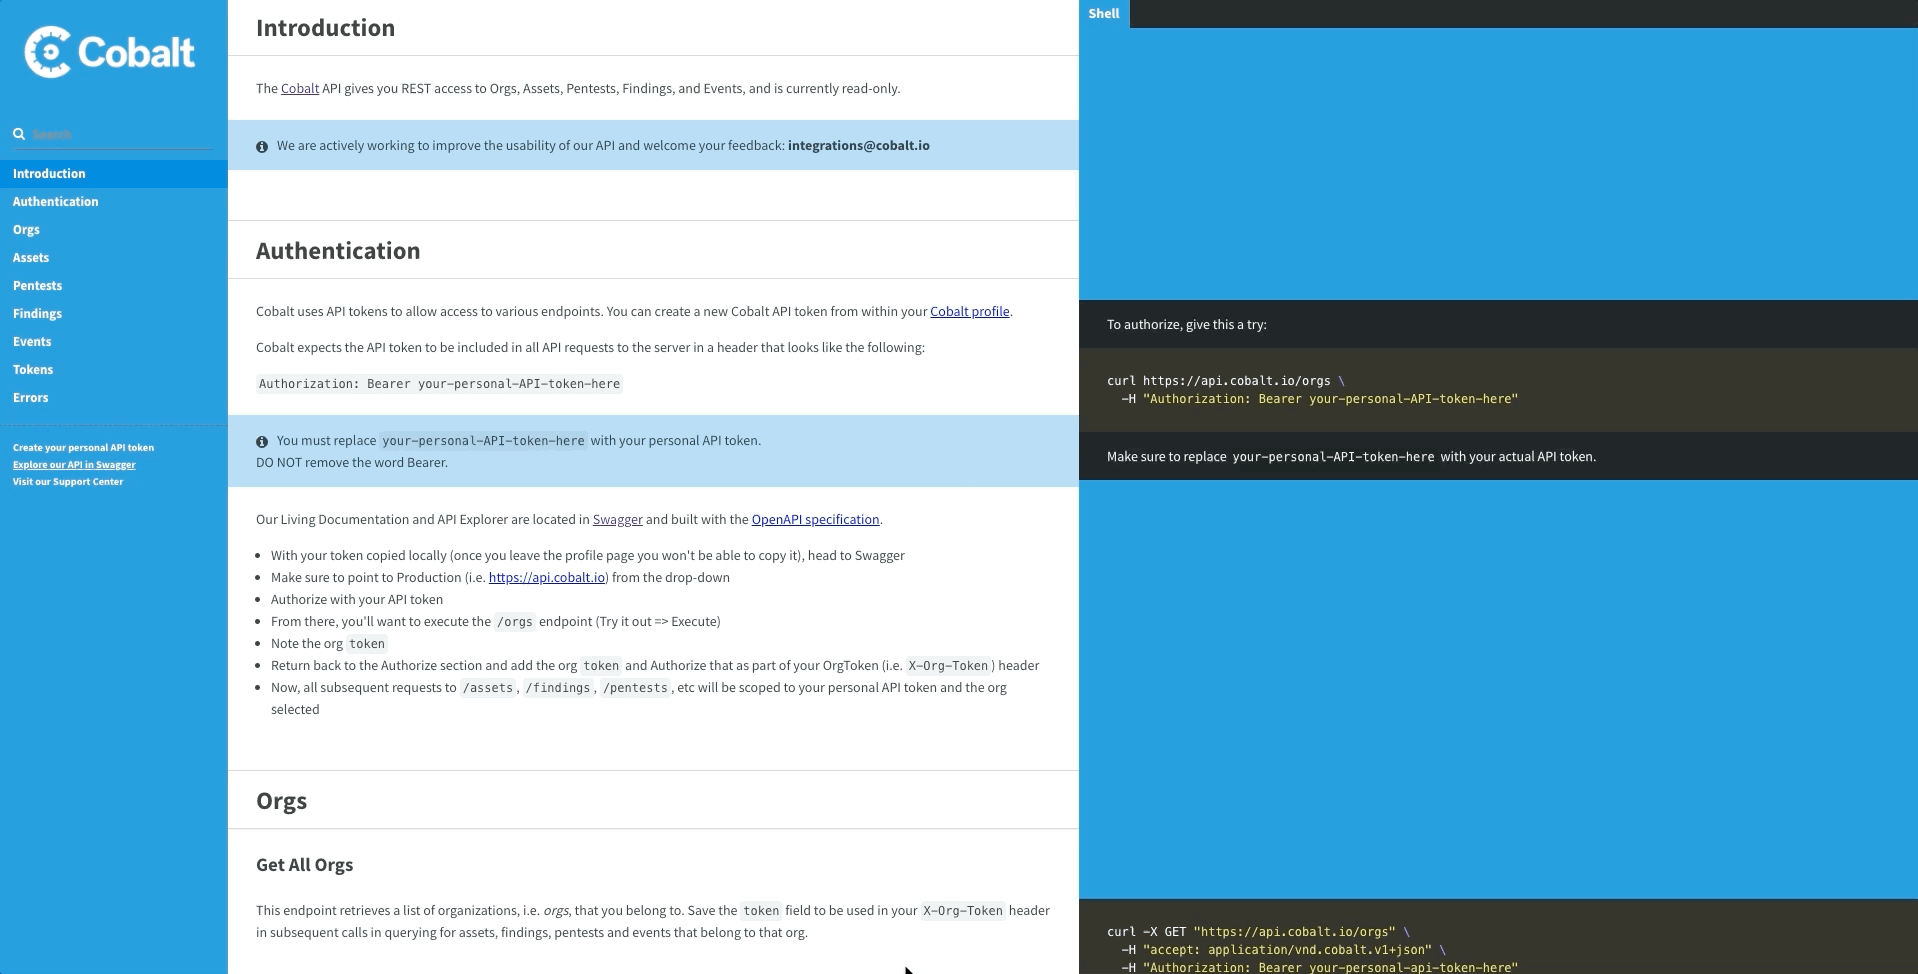
Paste your API Token into “Value” under ApiKeyAuth.
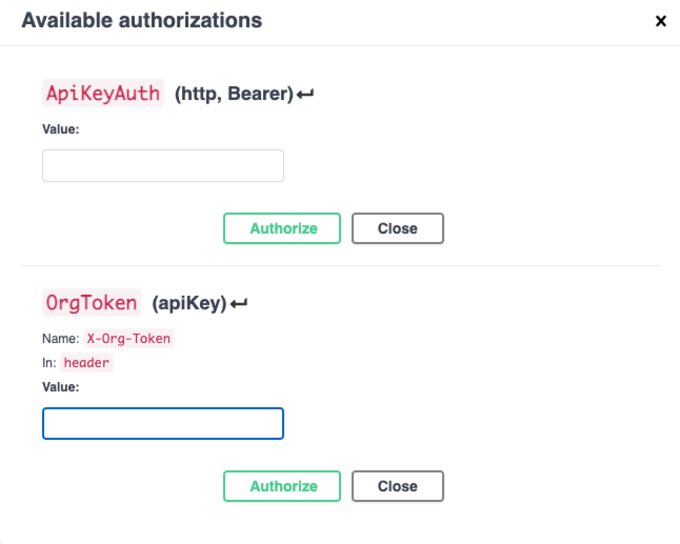
To get your Org Token, query the /orgs endpoint and copy the Org Token you’re interested in. You can perform this query directly from our console in Swagger or whatever tool you feel comfortable with. After obtaining the Org Token, you can query all endpoints inside the scope of the selected organization.
Importing Data Into Google Sheets
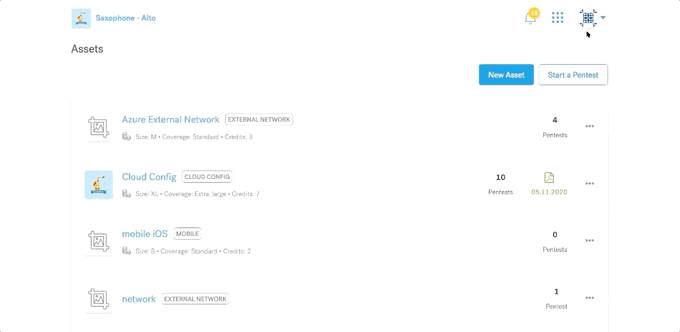
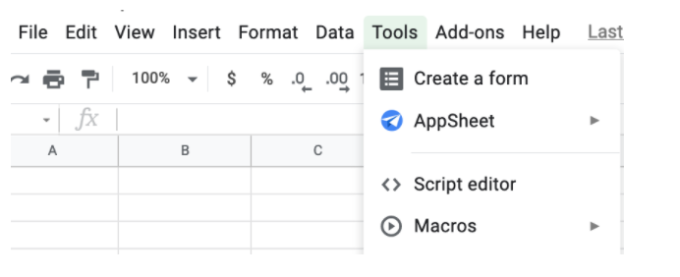
Let’s use this knowledge to create a custom report. For this example, you can import all findings from a single pentest. To do this you can use a custom Google function via “Script editor.”
You can use UrlFetchApp and SpreadsheetApp to download Findings from https://docs.cobalt.io/#findings to your spreadsheet.
Code to download and add findings looks like this:
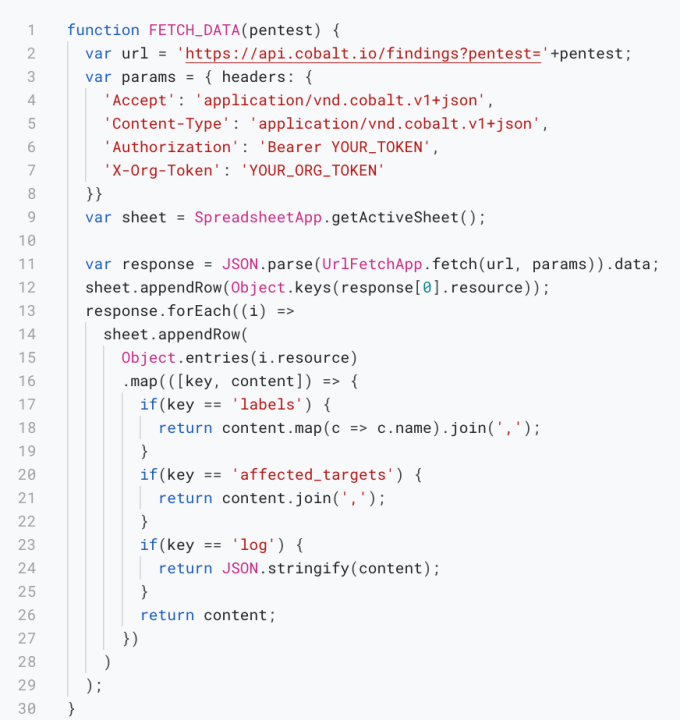
Now we can add =FETCH_DATA(pentest) inside the spreadsheet to download all findings for the specified pentest. Remember to update YOUR TOKEN and YOUR ORG TOKEN inside the code template.
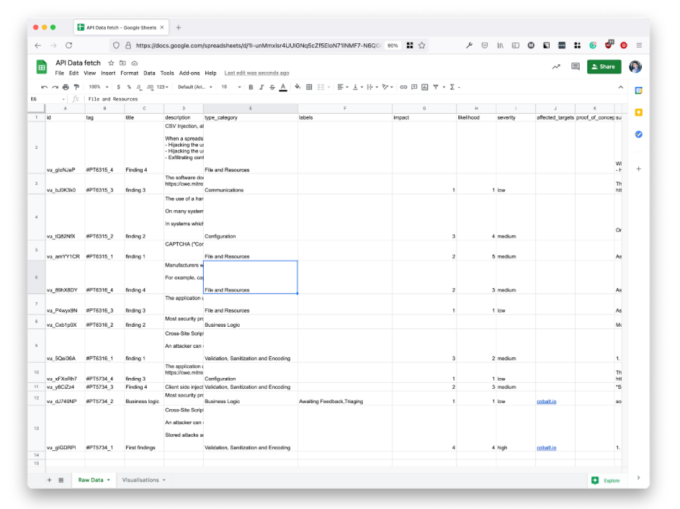
After importing raw data, you can use it to create whatever visualizations you want. Let’s create some basics like:
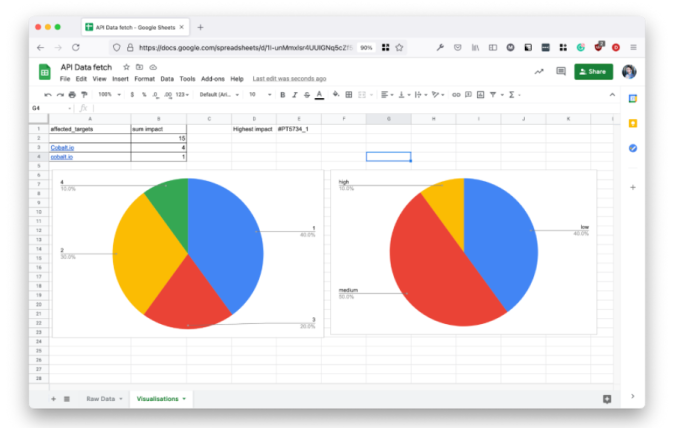
Sum of impact points per target
This we can do using simple QUERY inside a spreadsheet.
=TRANSPOSE(QUERY('Raw Data'!B:J, "SELECT J, SUM(G) group by J " , 1))
Where we SUM Impact points (Column G) and group them by Affected Targets (Column J).
Chart representing severity
From the Insert menu, we can choose Graph and select Column I as the data source.
Chart representing likelihood
From the Insert menu, we can choose Graph with Column H as the data source.
Chart showing the highest severity
=INDIRECT("'Raw Data'!B"&MATCH(MAX('Raw Data'!G:G),'Raw Data'!G:G,0))
The end result might look like this:
Access to Macros and Google Sheets is controlled separately. You can fine-tune to which parts of your data you want to give users access. This way you can generate live reports without giving them access to the Cobalt platform.
The Cobalt API is a tool that helps you get your data the way you want it to look. It allows you to import all your data from the API, and visualize it in any way. The possibilities are endless as to what this could be used for, from custom reporting to in-house synchronization with internal tools, there’s no limit!
If you’re interested in learning more about how to use our API, check our docs at docs.cobalt.io and stay tuned for more examples I share in the coming months with tools like Google Data Studio, Power BI, and Tableau. You can also share suggestions on more examples or improvements to the API by emailing us at integrations@cobalt.io.